

How To Analyse Trends
The Most Essential Skill in a Media Landscape Obsessed with Trends

Trend culture has never been more dominant or crucial to marketers, product developers, publicists, and journalists. Yet, truly understanding trends has never been more challenging. As algorithms become smarter and more personalised, our social media feeds have transformed into echo chambers, making it difficult to grasp broader cultural shifts. This has made the ability to analyse and interpret trends an essential skill for beauty professionals and beyond.
The purpose of this piece is to provide a clear guide on how to analyse trends: define what trends are, how they work, what different metrics mean, and outline their lifecycle to help you utilise trend analysis in your work. I’ve also started compiling a list of my most-used resources for those interested in developing their skills further.
This piece is part one of two. I’ve been developing a repeatable report and framework to provide beauty professionals with a one-stop resource for tracking trends, signals, and shifts in the beauty industry, helping them stay ahead of the curve. If you work in the industry and want the full breakdown, be sure to upgrade to paid to receive it in the next few days.
What is a Trend?
Not all trends are created equal. In fact, when we refer to something as a trend, it’s often not a trend at all—it’s either something much bigger or much smaller. The word "trend" has become a catch-all for any term, product, or style experiencing any level of growth.
According to Oxford Languages, a trend is “a general direction in which something is developing or changing.” By definition, this means a trend isn’t just a fleeting moment of attention. It requires sustained momentum, a domino effect where an idea infiltrates the masses. This is what differentiates a trend from a fad. A fad gains massive attention but is short-lived and doesn’t create lasting change. When we talk about trends in the context of social media, we’re often actually talking about fads. This confusion happens because we don’t always understand the different metrics used to measure trends and are often presented with vanity growth metrics that go unchallenged—but more on that later.
There are important distinctions between short-term and long-term trends. Trends, consumer signals, and industry shifts all fall into different categories, and understanding these nuances is key to making sense of what’s truly happening. In the context of social media analysis, we can think about them as follows.

Trends – A topic, keyword, hashtag, or piece of content that is gaining significant popularity and is being discussed widely by users at a particular time.
Signals – Patterns within these trends that reveal broader consumer interests in specific areas.
Shifts – The accumulation of these signals, reflecting deeper behavioural changes that reshape consumer habits and industry landscapes over time.
The three build on top of one another. So, how do we spot the difference? Thankfully, this process is quantifiable.
Understanding Trend Data
To measure trends, we typically use search data because it reflects purchase intent, which occurs further down the funnel than social media awareness. This helps eliminate baseless social media hype, focusing instead on trends that represent genuine consumer interest. Search data also allows for easier collection, making it far more effective when analysing multiple trends simultaneously.
Tools like Glimpse provide insight into search interest over time, helping us track trends through key metrics such as:
Volume – The number of times a keyword has been searched for in a given period. This is arguably the most important metric but is often overlooked. It gives scale to trends, providing necessary context when discussing growth. For example, a 500% growth might seem impressive, but it could simply indicate a jump from 1 to 500 searches, which lacks significance.
Growth Percentages
Year-on-Year (YoY) – YoY growth compares search volumes from a recent period to the same period last year. Given the current pace of social media trends, YoY growth is often the least relevant for measuring short-term trends but becomes crucial when assessing larger signals and long-lasting shifts.
Quarter-on-Quarter (QoQ) – QoQ compares the search volume of the last 90 days to the previous 90 days. This is my favourite metric because it captures the nuances of a trend beyond just its hyper-growth phases, helping to uncover its mid-to-long-term relevance.
Month-on-Month (MoM) – MoM compares the search volume of the last 30 days to the previous 30 days. In a TikTok-driven world, this is often the most relevant metric, but also the most misused. Without a broader context, this figure can be easily manipulated.
Other metrics can also be relevant depending on the use case. For instance, I like to look at traffic channels to understand where the growth is being driven from.
It’s also worth noting that while these metrics are universal, each platform measures them slightly differently. Every social media manager or influencer marketer will know the frustration of measuring a creator’s engagement rate—one platform may sum all engagement metrics together, another may give comments or shares greater weight than likes, and yet another might focus only on the last three posts instead of the last nine. Unfortunately, this inconsistency is common across media analyses, so understanding the specific definitions of each metric is crucial.
How To Spot a Trend, Signal or Shift
An example of a trend is the brand Lumebox, with its red light panel currently generating a lot of excitement on Instagram. By analysing google search data, we can see that while the interest is substantial (indicated by volume), it appears in short bursts rather than sustained growth. This pattern classifies it as a trend.

An example of a signal could be the rising consumer interest in LED masks, which demonstrates long-term, sustained growth, particularly with year-over-year (YoY) increases. The high search volume not only highlights the growing interest but also provides insight into the scale of this demand. This further indicates that it's a consumer signal, suggesting a broader shift in how people are approaching skincare.

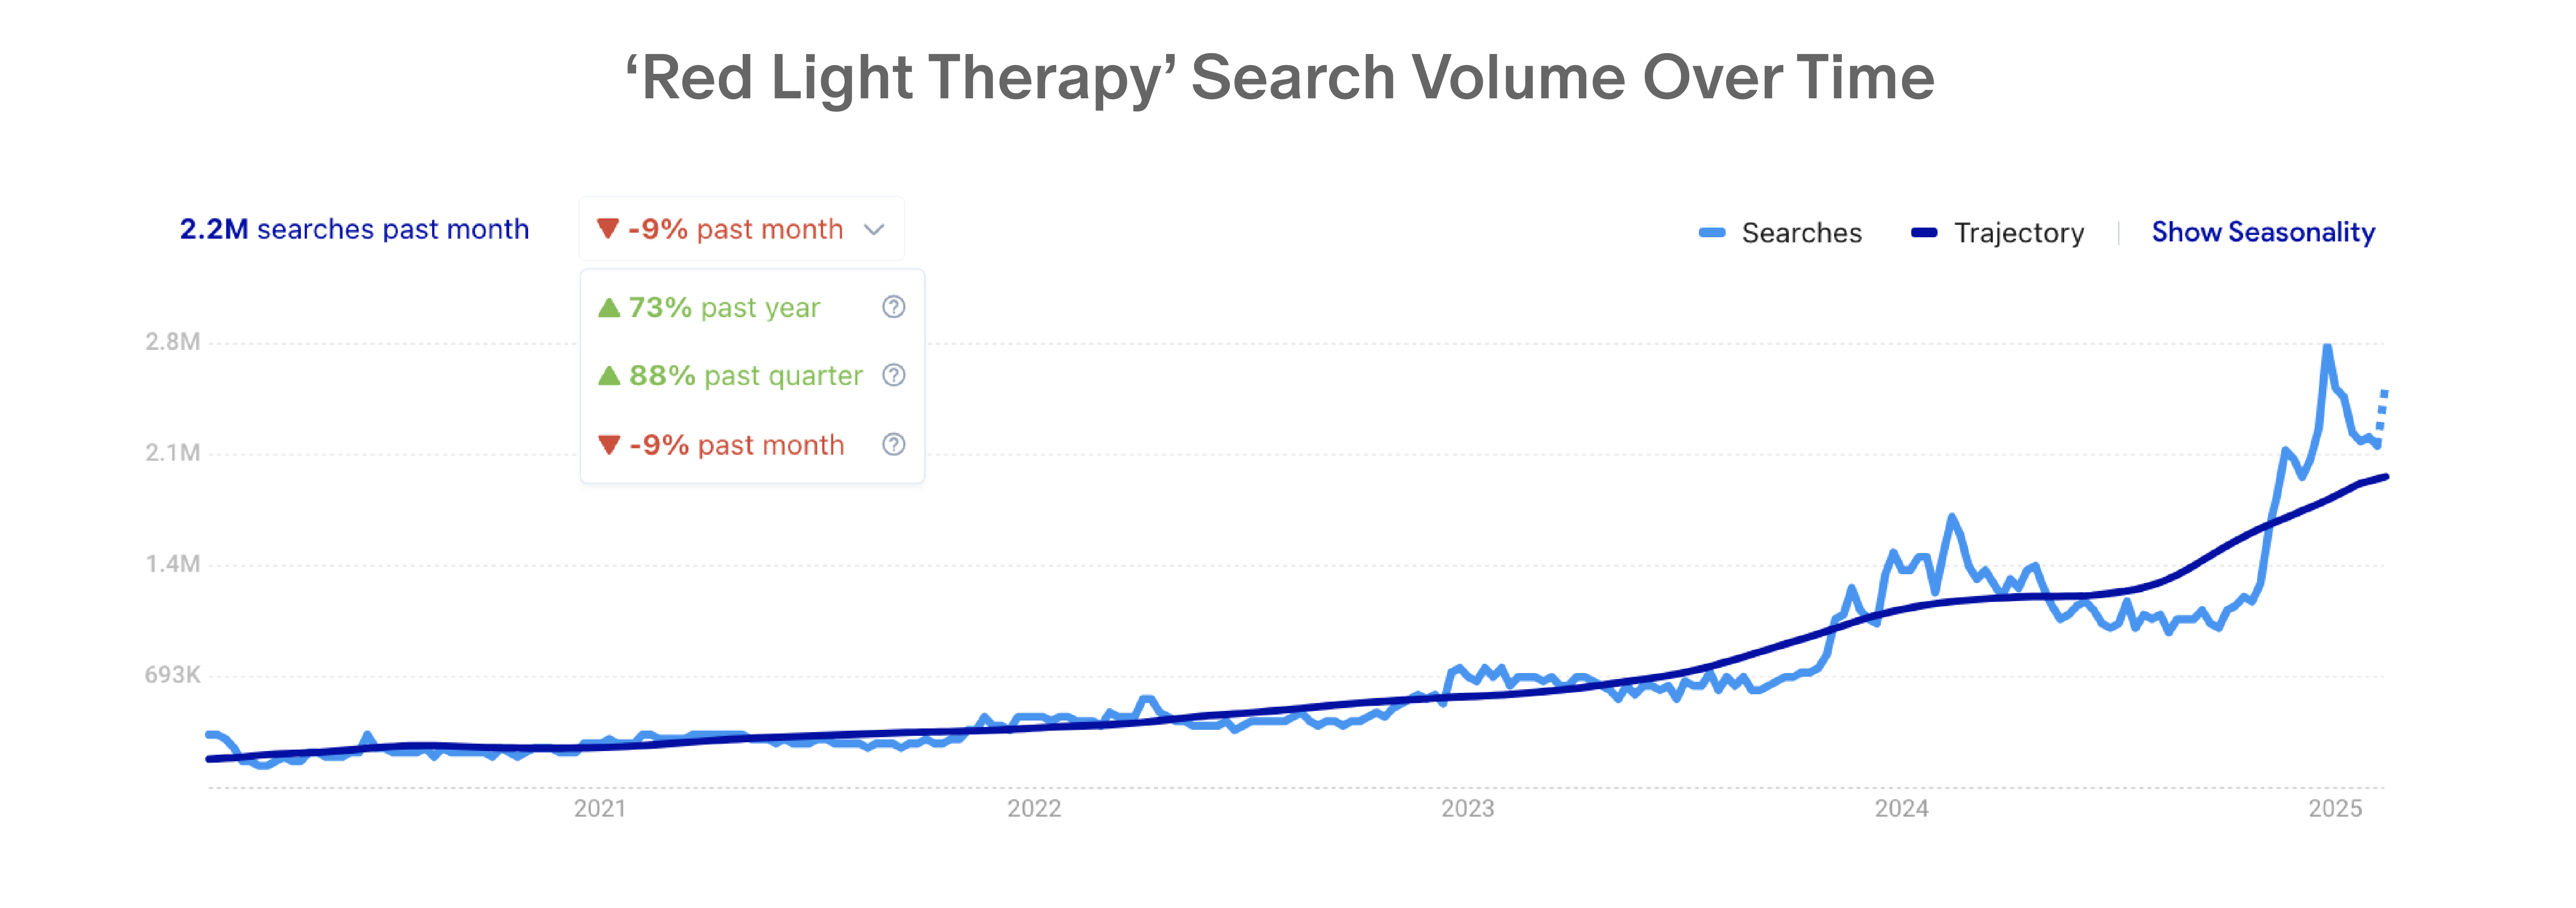
Finally, an example of a shift is the growing expectation that beauty products deliver professional-grade results, as seen with the rise of red light therapy over the last five years. While the high search volume in 2020 and 2021 seems insignificant compared to the surge in interest in 2023 and beyond, this shift highlights a growing consumer expectation for more advanced, effective at-home treatments.
What these examples prove is that, despite press releases claiming that brands start trends, trends don't emerge in isolation or get manufactured by a single entity. Each of these examples builds on the other.
The Lifecycle of a Trend
So, how do we spot trends before they take off, and which trends are relevant to whom? By selecting the metrics most relevant to your use case, you can plot them on a set of axes to help visualise how trends evolve over time. This allows us to map out the trajectory of trends more clearly.
As mentioned earlier, thanks to social media—TikTok especially—the pace of the trend cycle has increased tenfold. In my experience, looking at QoQ and MoM growth provides the best indication of a trend’s potential for sustained relevance.

Birth – When a trend first emerges, in its very early stages, it experiences month-on-month (MoM) growth but not at a volume significant enough to show positive quarter-on-quarter (QoQ) growth.
Growing – A trend in its prime stage is one that is experiencing positive MoM and positive QoQ growth. This is when creators, influencer marketers, and PR professionals should capitalise on it, as it’s gaining widespread attention and traction, but has not yet become oversaturated to the point where the public tires of it.
Maturing, Plateauing, or Fading – This stage can be confusing, as it can indicate that the trend is evolving into a signal. A period of decline in interest is typical for long-term shifts, as it’s necessary for sustainability. However, it can also signal that the trend is starting to fade in interest before dying out completely. Jumping on trends at this point becomes riskier.
Dead – Trends that have faded away completely, with little to no growth in search interest, marking the end of their life cycle.
The Caveat: Time and Pace
One major factor we haven’t accounted for is the pace of a trend moving from one stage to another over time. For example, a "viral" trend might experience such a sharp surge in interest that, within a day, the term has more interest than it did over the previous month and quarter (thus showing both positive MoM and QoQ growth) and going straight to the ‘growing’ phase. Such extreme growth is often unsustainable, so it would typically indicate a fad. However, this demonstrates the necessity of time and pace as factors to take into consideration. This is why platforms like Glimpse allow you to track trends and monitor them over time.
And that brings us to the end of this "how-to." As mentioned, this piece is laying the groundwork for a new format I'm rolling out—trend analyses designed to provide beauty professionals with all the data and insights they need to understand public interest at scale. The first in this series will be sent out shortly and will only be available to paid subscribers, so be sure to upgrade if you haven’t already to start receiving those.
You can connect with Barefaced across all platforms here.